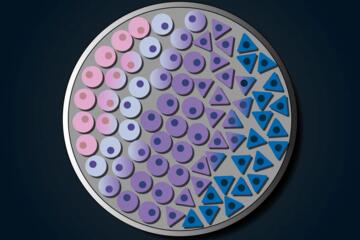
Multi-Omics In One System
Multi-omics refers to measuring more than one molecular layer from the same biological system, such as a tissue biopsy, blood sample, stool sample, or cultured cells. A single system can mean the same participant at multiple time points, the same specimen split into aliquots, or the same experimental condition across assays. The goal is not to “add more tests” but to connect different measurement types that respond on different timescales.
DNA omics captures relatively stable information like variants and copy number. RNA omics captures gene expression programs that shift with stimuli and disease states. Proteomics measures proteins that often reflect downstream regulation and post-translational changes. Metabolomics measures small molecules that reflect pathway activity and substrate availability. Microbiome profiling measures community composition and, in some workflows, microbial genes or activity markers. When these layers are measured together, researchers can test mechanistic hypotheses with fewer assumptions than using one layer alone.
In practice, multi-omics studies often start with a sample that is divided for different assays, then aligned using shared metadata such as collection time, processing delays, and storage conditions. If you have ever seen a dataset where “RNA-seq” and “metabolomics” come from different aliquots collected on different days, you already know why alignment can fail—sometimes the biology is real, sometimes the batch effect is doing the talking.
Common Pain Points And Misreads
People often assume that multi-omics automatically yields a single coherent story, but each omics layer has distinct measurement noise, coverage limits, and biological interpretation rules. RNA abundance does not always predict protein abundance because translation efficiency and protein degradation vary. Metabolite levels can lag behind gene expression because enzymes, cofactors, and transport steps add delay and buffering.
Another frequent misread comes from sample handling. RNA is sensitive to collection-to-freezer time; metabolite profiles can shift with temperature and extraction chemistry; proteomics can be biased by digestion efficiency and ionization behavior. Even when a study reports “matched samples,” the matching can be imperfect if aliquots were processed with different protocols or run on different instrument batches. A small aside from data review work: a “fast” protocol still leaves a gap between the moment a tube leaves the clinic and the moment it reaches -80°C, and that gap shows up as systematic variation in RNA quality metrics like RIN.
Dependencies also get overlooked. Multi-omics integration depends on normalization choices, missing-data handling, and statistical models that treat each omics type differently. If a study uses a single integration method without checking whether it respects the scale and distribution of each assay, the combined results can look persuasive while being fragile. Many readers also miss that “correlation across layers” does not establish causality; it can reflect shared upstream drivers, confounding, or simply co-regulation.
What To Measure And Why
DNA-focused assays measure variants, methylation patterns, and structural changes depending on the platform. Whole-genome sequencing and targeted panels can identify variants linked to disease risk, drug metabolism, or inherited traits. DNA methylation profiling captures epigenetic marks that can mediate longer-term regulation, though methylation is cell-type dependent and varies with tissue composition.
RNA assays measure expression levels and, in some workflows, splice isoforms and fusion events. Bulk RNA-seq averages signals across mixed cell populations, while single-cell RNA-seq separates cells but increases complexity and cost. Proteomics can quantify thousands of proteins using mass spectrometry, yet coverage depends on sample complexity and instrument settings. Metabolomics can target known metabolites or run untargeted profiling; untargeted results often require careful annotation and can produce false identifications if spectral libraries are limited.
Microbiome profiling adds another layer of interpretation. 16S rRNA sequencing estimates taxonomic composition, while metagenomics can infer microbial genes. Metatranscriptomics measures RNA from microbes, which can better reflect activity but remains technically demanding. If the study’s goal is host biology, microbiome signals still require careful separation of host and microbial contributions in the sample.
Solutions And Practical Advice
Start With A Clear Biological Question
Before choosing assays, define the inference you want. If you want to understand pathway activity, metabolomics and proteomics often map more directly to enzymatic steps than DNA variants alone. If you want to predict drug response, pharmacogenomic DNA variants and expression signatures can matter, but you still need to check whether the study measured the relevant tissue and whether the sample timing matches the drug exposure window.
In a typical design, researchers may measure DNA plus RNA plus proteomics from the same specimen split into aliquots. A realistic outcome target is not “one biomarker,” but a set of candidate features that replicate across independent cohorts. A study that reports only within-cohort associations without replication often reads like a hypothesis generator, not a validated measurement.
Use Matched Samples And Track Processing
Ask how samples were matched: same participant and same time point, same tissue region, and similar processing timelines. Look for reported pre-analytical variables such as collection-to-freeze time, storage temperature, extraction batch, and instrument run dates. If you see a version number in the methods section—example: “MaxQuant 2.0.3.0” for proteomics—check whether the same version and parameters were used across all samples.
For RNA, quality metrics like RNA integrity number and mapping rates help interpret whether differences reflect biology or degraded material. For metabolomics, extraction solvent and normalization strategy matter; for proteomics, digestion protocol and missing-value handling can shift results. When the paper does not report these details, you can still read the findings, but you should treat layer-to-layer claims as tentative.
Plan Integration With Transparent Methods
Integration methods vary: some use correlation networks, others use multivariate models, and some use latent-factor approaches. The key evaluation step is whether the method was tested for stability under resampling and whether it handles missingness without inflating signals. If a paper reports that a model was trained on one cohort and tested on another, check that the preprocessing steps were applied consistently to the test set.
As a practical check, look for how they handle scaling across omics types. RNA counts, protein intensities, and metabolite peak areas do not share the same distributional assumptions. A mild frustration point: many summaries mention “normalized data” without stating the exact normalization method, leaving readers unable to judge whether the integration is sensitive to outliers.
Interpret Layer Links With Mechanistic Limits
When you see a gene-to-protein link, remember that translation and degradation can break the relationship. When you see a protein-to-metabolite link, remember that metabolite levels depend on transport, cofactors, and competing pathways. When you see a DNA-to-RNA link, remember that methylation and chromatin state vary by cell type and tissue composition.
Use cell composition estimates when bulk assays are involved. If a study uses deconvolution for RNA-seq, check whether it also adjusts for cell-type proportions in proteomics or metabolomics interpretations. Without that, a “differential expression” result can reflect shifts in cell populations rather than changes within the same cell type.
Case Examples From Research Designs
Inflammation Panel With Host And Metabolites
An anonymized cohort of adults with suspected inflammatory disease provided blood samples at a baseline visit and after a treatment change. Researchers split each blood draw into aliquots for RNA-seq and targeted metabolomics, then used proteomics on a subset due to sample volume limits. The analysis found that RNA markers of interferon signaling rose in the same individuals where certain amino-acid metabolites shifted, while protein changes lagged by one sampling interval. The study treated the lag as a biological timing clue rather than forcing a one-to-one mapping.
The lesson for readers: multi-omics can measure different layers that move at different speeds, so “not matching” across layers can still be informative when the study design includes repeated time points.
Microbiome Plus Host Expression In Gut Tissue
In another anonymized study, researchers profiled gut tissue and stool from participants with gastrointestinal symptoms. They performed host RNA-seq on tissue, microbiome taxonomic profiling on stool, and metabolomics on stool extracts. The strongest associations linked microbial community shifts to stool metabolite patterns, while tissue RNA changes correlated with a subset of those metabolite features. The paper emphasized that stool reflects luminal chemistry and microbial activity, while tissue RNA reflects host responses, so the links were interpreted as cross-compartment signals.
The lesson for readers: multi-omics can connect compartments, but the direction of inference depends on sample type and biology.
Comparison Checklist For Studies
| What You Check | DNA/RNA | Proteomics | Metabolomics/Microbiome |
|---|---|---|---|
| Sample matching | Same aliquot or same time point | Same tissue region or consistent digestion workflow | Same extraction batch and storage conditions |
| Pre-analytical variables | Collection-to-freeze time, RNA quality | Protein extraction and digestion details | Extraction solvent, normalization, annotation confidence |
| Integration method | Normalization and batch correction | Missing-value handling and scaling | Taxonomic vs functional interpretation |
| Evidence strength | Replication across cohorts | Independent validation of protein targets | Independent metabolite annotation and test set performance |
Step-by-step checklist you can use while reading a paper: (1) identify the exact sample type and time points, (2) confirm whether assays used matched aliquots, (3) check reported quality metrics and batch variables, (4) read the integration method section for normalization and missingness handling, (5) look for external validation or at least cross-validation with strict separation, and (6) map claims to the biology you can justify from the measured layers.
Common Mistakes That Reduce Trust
One mistake is treating “multi-omics” as a guarantee of accuracy. If the study uses small sample sizes and many features, statistical overfitting can produce patterns that do not replicate. Another mistake is ignoring cell composition. Bulk RNA-seq differences can reflect shifts in immune cell proportions, and proteomics can show similar shifts without changing per-cell biology.
Readers also over-trust metabolite identifications in untargeted workflows. Spectral matching can mislabel compounds when libraries are incomplete, and some studies report annotation levels without clarifying confidence. Microbiome results can also mislead when stool collection timing, diet, antibiotics, and sequencing depth are not controlled or reported.
Finally, promotional writing often appears as “one pathway explains everything.” Multi-omics can suggest pathways, but it rarely proves them without perturbation experiments such as controlled dosing, gene knockdown, or enzyme inhibition. If a paper lacks mechanistic follow-up, treat pathway claims as hypotheses.
FAQ
What does multi-omics measure?
It measures multiple molecular layers such as DNA variants or methylation, RNA expression, proteins, metabolites, and sometimes microbial composition or microbial genes from the same study system.
Can multi-omics prove cause and effect?
Most observational multi-omics studies show associations across layers. Causality usually needs perturbation, longitudinal timing with strong assumptions, or experimental validation in models.
Why do RNA and protein results disagree?
Translation efficiency, protein degradation, and post-translational modifications can change protein abundance without matching RNA changes, and bulk samples can mix cell types.
How do researchers match samples across assays?
They typically split a specimen into aliquots or use repeated sampling at defined time points, then align data using shared metadata and batch variables; mismatches can create false signals.
What should I look for in study methods?
Look for pre-analytical variables, quality metrics, normalization and batch correction details, missing-data handling, and whether results replicate in independent cohorts.
Author's Insight
Multi-omics works best when the study design respects biology’s timing and compartment differences. DNA, RNA, proteins, and metabolites respond on different timescales, so repeated sampling and clear pre-analytical reporting matter more than the number of assays. Integration methods can either reduce noise or amplify artifacts, depending on normalization, missingness handling, and validation strategy. When a paper reports quality metrics and external testing, the layer-to-layer claims become easier to evaluate without assuming a single “master” biomarker.
One practical way to read multi-omics results is to translate each claim back to the measured layer. If a claim depends on an unmeasured mechanism, it belongs in the hypothesis column, not the conclusion column.
Key Takeaways
- Multi-omics measures multiple molecular layers from the same system, but each layer has different interpretation rules and noise sources.
- Sample matching and pre-analytical variables often determine whether layer-to-layer comparisons reflect biology or processing artifacts.
- Integration requires transparent normalization, batch correction, and missing-data handling; weak methods can create convincing but fragile patterns.
- Layer disagreements (RNA vs protein, host vs stool) can be biologically meaningful when the study includes timing and compartment context.
- Strong evidence includes replication and validation; mechanistic claims without perturbation remain hypotheses.